Debugging in PHP and WordPress
What do you do when things just aren't working? Debugging, PHP and WordPress
Debugging an application is a basic activity that is done when something doesn’t work. Whether you are using
echo ("hello");die ("not working");The "die" method is especially useful to find out if the code we see is the one that is running on the server and the one we want to investigate at the moment. In the past, I would do a correction, wonder why it didn't help, and then find out I was working on the wrong directory. So now, this method is my first point of call.
Sometimes, just because we don't see an error doesn't mean it doesn't exist. I have worked on applications where the warning display was turned off at so many levels that it was virtually impossible to find out what was wrong. When this happens, you actually have to fire up the debugger and check what's going on step by step, because you can't rely on logs and messages.
One of my favorite troubleshooting methods is code reduction and "breaking more": taking the problematic snippet of code and removing more and more unnecessary parts from it while observing the changes. We reduce this code to a fragment that leaves only the problematic element visible, and then we try to find a solution. In my experience, this is a very effective method - much better than simply looking at the code and trying to come up with a solution.
Displaying errors
By default, PHP errors are not displayed, as this could leak sensitive information indicating how the application is built. However, in the development environment, it is a good idea to enable these messages to flag errors without having to look at the logs. To do this, add the following code to your application:
<? Php
       ini_set ("display_errors", 1);
       error_reporting (E_ALL);
        // code goes here
?>
When using a framework (Zend, Symphony) this option is enabled by default in development mode.
Basic Methods for Displaying Data
My favorite method for quickly checking the current situation is die ($ variable), which allows you to quickly judge what data has ended up in a variable. However, this is only helpful for quick tests and simple cases. If your data structures are more complex, I recomend other methods, such as:
print_r ($ variable)
var_dump ($ variable)
What if you wanted to gather more information about a variable or where a problem occurs? These methods are definitely worth a try:
get_defined_vars ();retrieves a list of variables declared in a given place. This is useful when you want to add functionality to the application and find out what you can use in a certain location.debug_zval_dump ();retrieves a variable and the number of references to it. This helps to assess where a given variable is also used.debug_print_backtrace ();displays the entire invocation path to a given location, and lets you find out what triggered this in the code.
Here's an example of how these functions work:
var_dump($someObj)
object(stdClass)#1 (2) {
  ["car"]=>
  string(3) "suv"
  ["engine"]=>
  string(2) "v8"
}

print_r($someObj);
stdClass Object
(
    [car] => suv
    [engine] => v8
)

print_r(get_defined_vars());
Array
(
    [_GET] => Array
        (
        )

    [_POST] => Array
        (
        )

    [_COOKIE] => Array
        (
        )

    [_FILES] => Array
        (
        )

    [argv] => Array
        (
            [0] => /home/q/Projects/muscula/Muscula2Loggers/muscula-php-logger/dsadas.php
        )

    [argc] => 1
    [_SERVER] => Array
        (
            [PATH] => /usr/local/bin:/usr/sbin:/usr/
            [DOCUMENT_ROOT] =>
            [REQUEST_TIME_FLOAT] => 1635255534.3531
            [REQUEST_TIME] => 1635255534

        )

    [someObj] => stdClass Object
        (
            [car] => suv
            [engine] => v8
        )

)

debug_zval_dump($someObj);
object(stdClass)#1 (2) refcount(2){
  ["car"]=>
  string(3) "suv" refcount(1)
  ["engine"]=>
  string(2) "v8" refcount(1)
}

debug_print_backtrace();
Debugging with IDE + Xdebug
This is the most effective way to debug. This method allows you to set breakpoints (i.e., where the code stops) so that you can see what is happening to the data in a given location. Plus, it allows you to evaluate the expression; for example, checking what happens when you change plus to minus, or checking the sum of two variables. There is no need to change the code to do this.
It doesn’t matter what IDE you use – you’ll still need Xdebug.
Xdebug’s installation varies depending on the operating system. With Linux, it's simple. You just execute this command:
sudo apt install php-xdebugFor Windows, you need to install the Debug Pack version or manually install the extension. Once this is complete, you can get to work.
PHP Storm
Select Run -> Edit Configurations from the menu.

In the displayed window, press the plus (+) button (“Add new configuration”) and then select "PHP Web Page" from the list.

In the configuration window, select the server on which the application runs (local Nginx or Apache).
After pressing "Apply" and "OK" start debugging using the bug icon on the toolbar.

Then, you can mark the breakpoint with a red dot and the app will stop where you want it.

Debugging WordPress
One way to view errors in WordPress is to turn on the WP_DEBUG mode. You do this by changing the wp-config.php file and adding a line to the beginning:

Important: You should NEVER turn on this mode in production.
Here’s the thing: displaying errors in this mode is quite inconvenient. For one thing, you can’t count on displaying errors from asynchronous calls directly, which sometimes completely prevents the use of a website or some of its functions. Fortunately, there are better options.
If you want to send all debug messages to the log, enable the option:
define ('WP_DEBUG_LOG', true);This will make all these messages log in the Debug.log file.
You can also specify the name of a given file:
define ('WP_DEBUG_LOG', '/logs/wp-errors.log');Finally, you can control the display of messages using this setting:
define ('WP_DEBUG_DISPLAY', true / false);PHP Console
https://a11yDark.com/barbushin/php-consoleThis project allows you to display PHP errors in the browser console. This comes with a very important advantages:
- you know about the error no matter where it occurred.
- you can view the values of the variable without displaying them on the page.
- it formats the variables nicely.
Installation is quite simple. Just download the PHP Console library, put it in the WordPress directory or any other website or application and add this code snippet:
$ handler = PhpConsole \ Handler :: getInstance ();
$ handler-> start ();
Then, install the PHP Console extension to the Chrome browser - and you’re done!
The one downside is that the project has been underdeveloped for a long time, so be prepared that there might be an issue launching some newer projects.
Logging and Debugging with Muscula

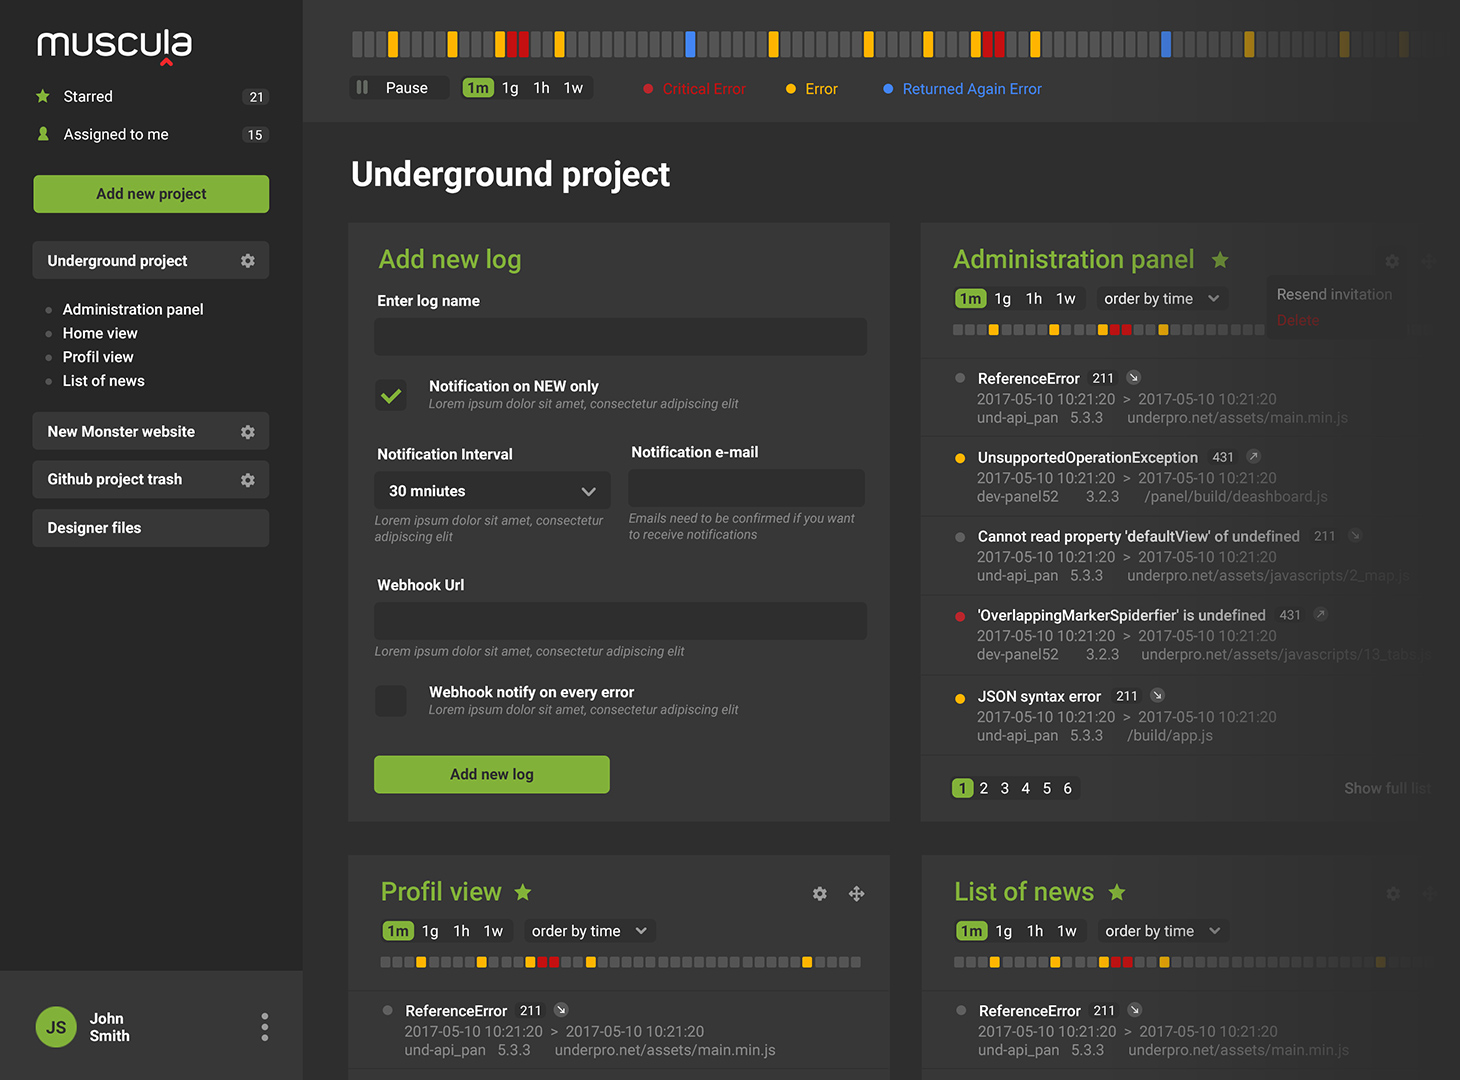
Muscula (https://www.muscula.com/) is a logging and error analysis system. By adding a code snippet to the application, Muscula allows you to view all errors that occurred in that snippet in a clear interface. It also allows for debugging, even in production.
Integration is very simple. Just create an account at https://www.muscula.com/ and add a new project and log. Then use composer to install the library:
composer require muscula / muscula-php-loggerIf you do not use composer, simply download the system from gitlab https://gitlab.com/muscula-public/muscula-php-logger.
Finally, add the code that was showed in "Integration Instructions" in Muscula application after adding the log.
$ handler = Handler :: getInstance ();
$ handler-> start ('<YOUR LOGOID>');
If you want to debug the value of a variable in production, you can use the debug function:

The advantage of this solution is that, in addition to logging backend errors, you can also add a second log that will monitor errors in the browser on each user's device. After adding the log, the JavaScript code fragment will be displayed again, and it should be pasted into the header of the page.
Logging in and debugging WordPress with Muscula
You can also use the Muscula system in WordPress. For this purpose, you can add code similar to the one above for every website written in PHP. You can also install a dedicated plugin called Muscula (Menu Settings -> Plugins -> Add New). After installation, the plug-in needs to be configured. To do this, enter LOG_ID in the configuration screen.

Summary
There are many ways to analyze errors. Choose the one that saves you the most time. Web pages or applications written in PHP can work very efficiently, as long as we make sure to know about the problems. Checking everything in your own environment is not always the same as working in production. Therefore, it is worth using additional tools that improve our work, especially when they are available like Muscula for free.